Site Details
The Site Details page provides information including Site status, Device information, power generation data, Alarm information, and configuration settings.
Steps:
In the Site list, locate the target Site and click the Site name.
The system enters the Site Details page.
The Site Details page contains the following tabs:
- Overview
- Device
- Chart Data
- Alarm
- (Remote) Settings
- Commissioning
- Site Configuration
- Gateway Traffic Statistics
NOTE
The tabs actually displayed may vary depending on the Site type.
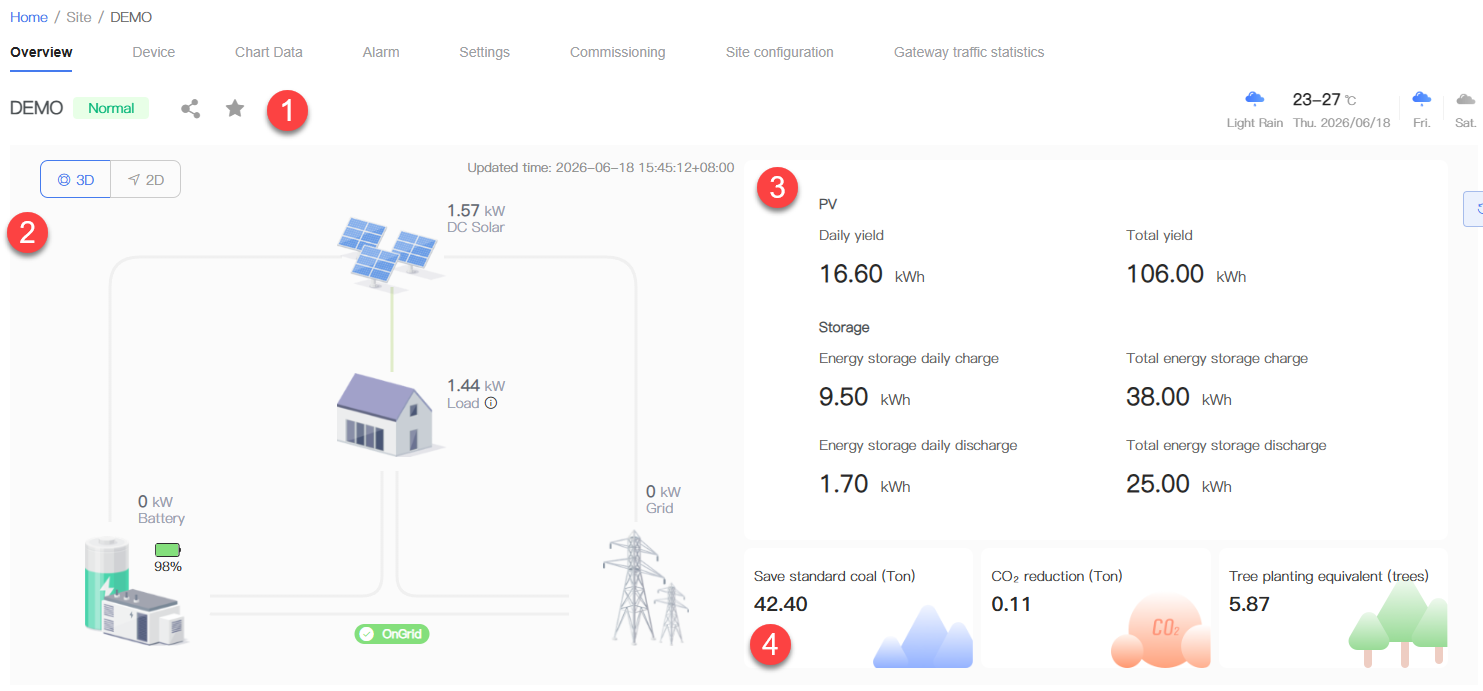
Site Overview
The "Overview" tab provides a summary of Site status, energy flow, power data, power generation statistics, and environmental benefits.
| No. | Name | Description |
|---|---|---|
| 1 | Site Information | Displays the Site name, operating status, weather information, and the latest data update time. |
| 2 | Energy Flow Diagram | Displays the real-time energy flow direction and power data of the Site. The energy flow diagram displays different topological structures based on the Site type. Click 3D or 2D to switch the display mode. |
| 3 | Power Generation Overview | Displays PV power generation and energy storage charge/discharge statistics, including daily and cumulative values. |
| 4 | Energy Saving and Emission Reduction | Displays environmental benefit indicators such as standard coal saved, CO₂ emission reduction, and equivalent trees planted. |
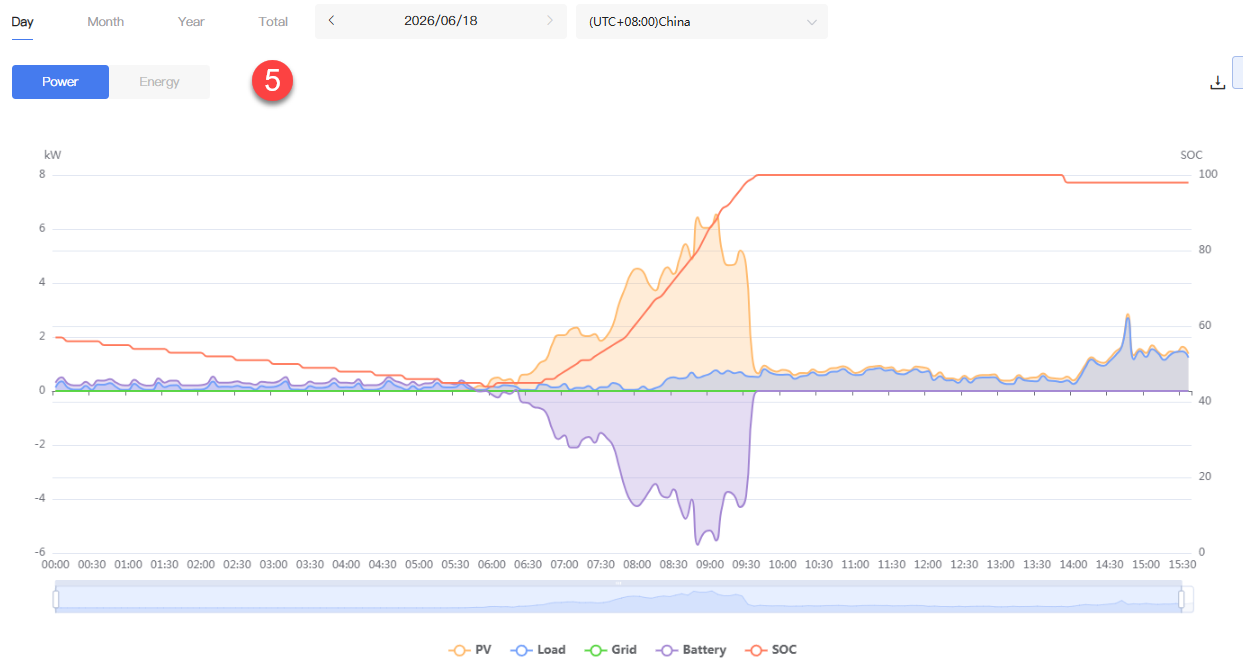
| 5 | Trend Analysis | Displays the power and Energy change trends within the selected time range. Users can switch between Day, Week, Month, Year, and Cumulative views; select a date; switch the data display time zone; switch between the power chart and energy chart; and export chart data. |
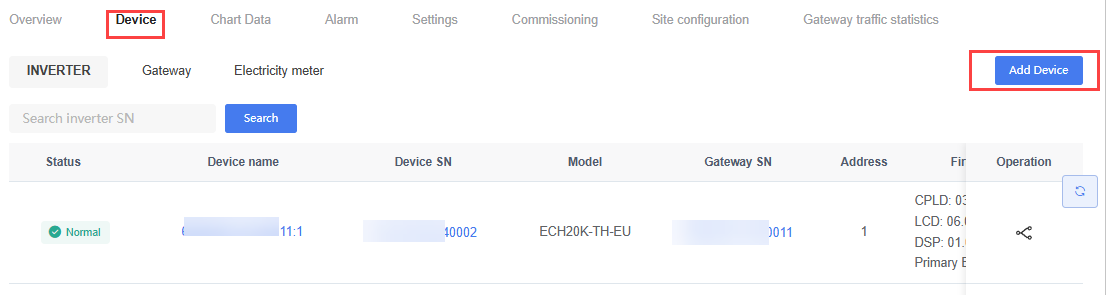
Device
The Device tab displays all Devices associated with the Site, including Inverters, Gateways, and Electricity Meters. Users can search for Devices by Device type. Click the Device name, Device SN, or Gateway serial number to enter the corresponding Device Details page. For Device details and Device operations, see Device.
The Device page includes the following Device categories:
- Inverter
- Gateway
- Electricity Meter
Add Device
Use this function to add a Gateway and its associated Devices to the current Site.
Steps:
- In the "Device" tab, click "Add Device".
Enter the Gateway serial number in the "Gateway SN" input field.
Click "Confirm".
The Gateway and its associated Devices are added to the current Site.
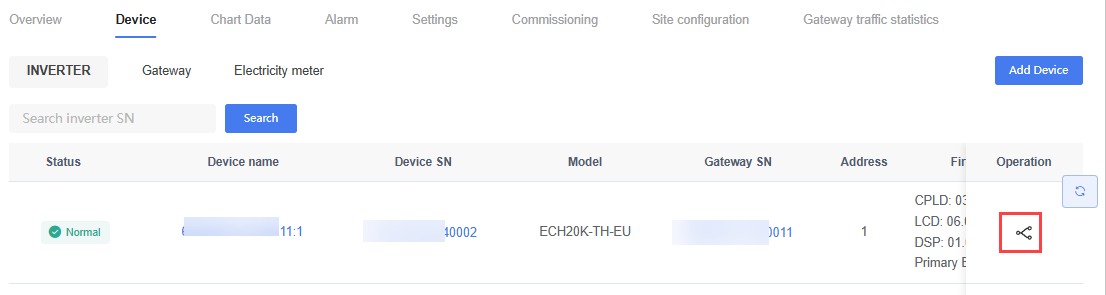
AC Coupling
Use this function to establish an AC coupling relationship between an energy storage Inverter and one or more Inverters.
Steps:
Click the "Inverter" tab.
In the "Operation" column, click the "AC Coupling" icon.
On the "AC Coupling" page, click "Select the Coupling Device".
In the Device list, select one or more PV Inverters, then click "Confirm".
The selected Devices appear in the "Coupled Devices" area, indicating that the AC coupling relationship has been successfully established.
TIP
Only energy storage Inverters support initiating AC coupling.
PV Inverters can only serve as coupled Devices.
There is no limit on the number of coupled Devices.
After establishing AC coupling, the coupled Devices display the AC Coupling icon in the Device list.
Remove AC Coupling
The AC coupling relationship can be removed through either of the following methods.
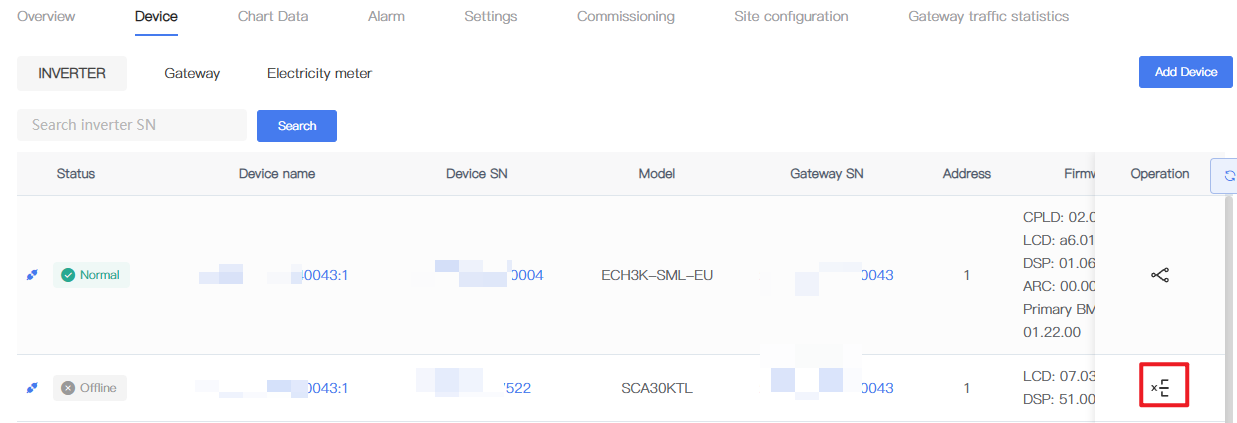
Method 1: Remove via Device list
In the Device list, locate the Device with the AC Coupling icon.
In the "Operation" column, click the "Remove Coupling" icon.
Method 2: Remove via AC Coupling page
Click the "AC Coupling" icon of the target Device.
In the "Coupled Devices" area, locate the target Device and click "Decouple".
After removing the coupling, the Device is removed from the "Coupled Devices" list, and the AC Coupling icon in the Device list disappears.
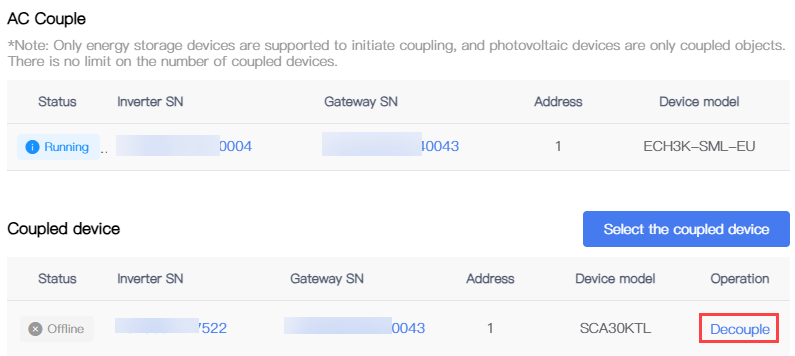
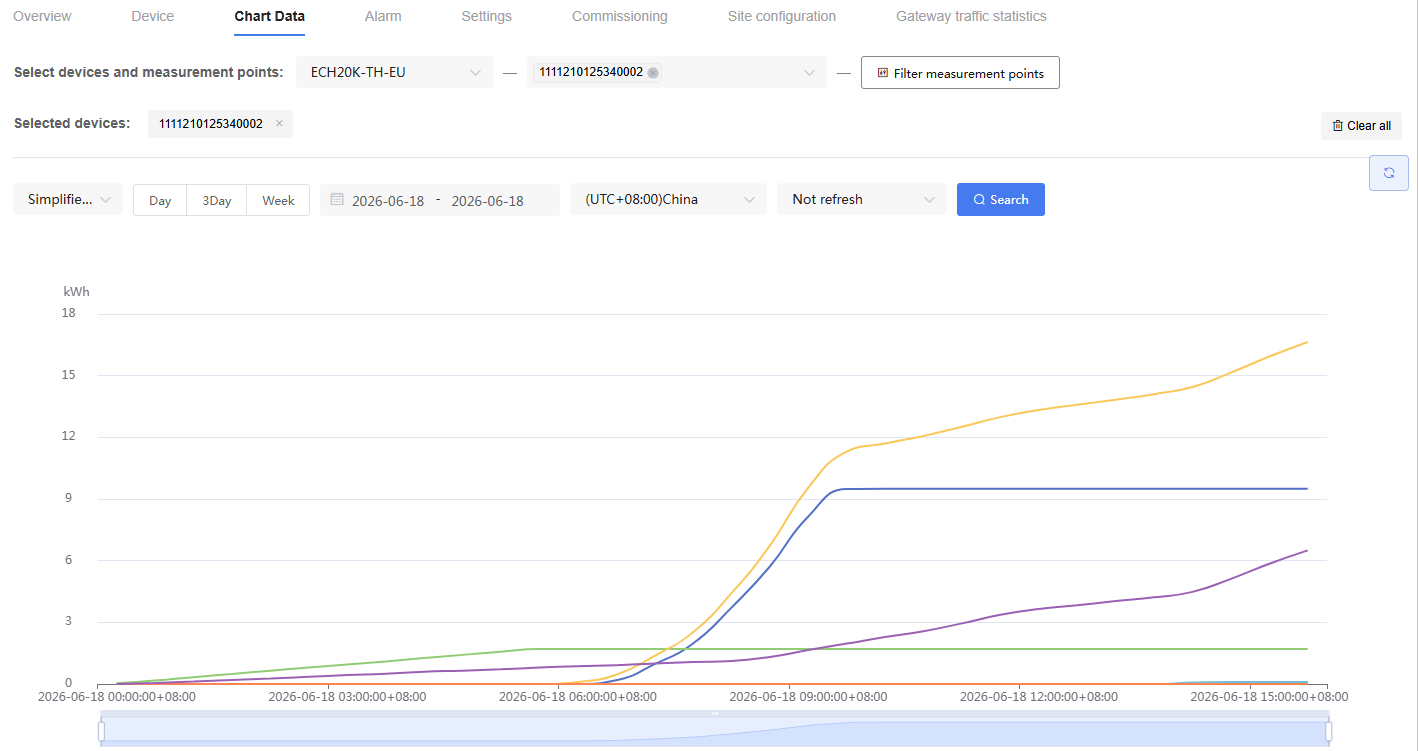
Chart Data
The "Chart Data" tab is used to view the historical operating data and trend charts of Site Devices.
Steps:
Select the model.
Select the Device (up to 5 Devices at a time).
Click "Filter Measurement Points" and select one or more measurement points (up to 20 measurement points at a time).
Select the chart type, time range and date, and data display time zone.
View the trend data in the chart area.
Alarm
The "Alarm" tab displays Alarm events generated by Site Devices, including Alarm type, Alarm content, Device information, occurrence time, and Alarm status.
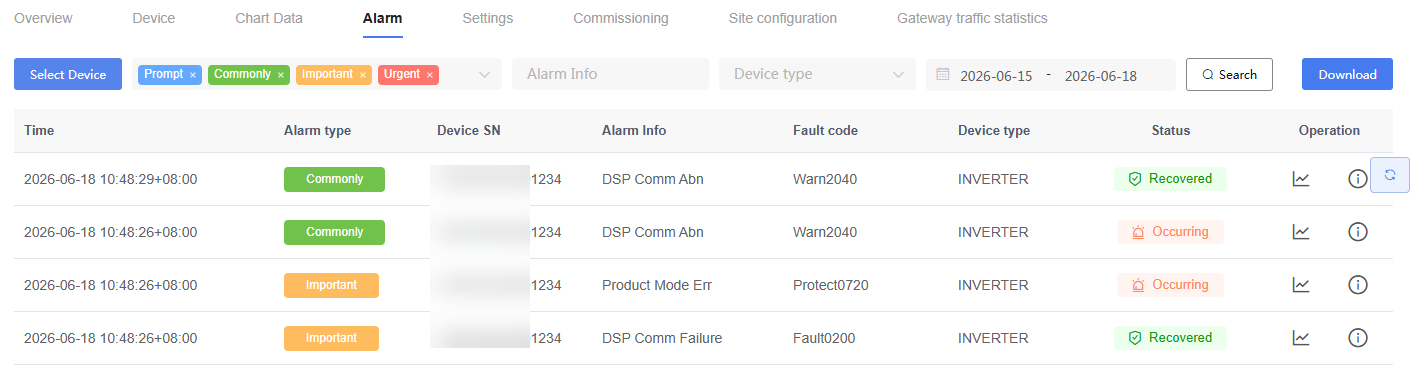
Search Alarm Events
Steps:
Click the "Alarm" tab.
Use one or more of the following criteria to filter Alarm events:
Select Device: Select a Device.
Alarm Type: Select the Alarm type.
Alarm Content: Enter a keyword to search for specific Alarm content.
Device Type: Select the Device type.
Time Range: Select the start date and end date.
For descriptions of Alarm types and Alarm statuses, see 7.2.4.2 Alarm Types and Alarm Statuses.
Click "Search".
Alarm events meeting the criteria appear in the Alarm list.
Click "Download" to export Alarm records.
Alarm Types and Alarm Statuses
| Alarm Type | Description |
|---|---|
| Urgent | The Device has stopped operating and requires immediate attention. |
| Important | The Device's operating efficiency is affected and requires timely attention. |
| General | Does not affect Device operation; can be handled as needed. |
| Info | Informational messages. |
Table Alarm Type Descriptions
| Alarm Status | Description |
|---|---|
| Recovered | The Alarm has been cleared. |
| Active | The Alarm is still ongoing. |
Table Alarm Status Descriptions
Alarm Operations
In the "Operation" column, you can perform the following operations:
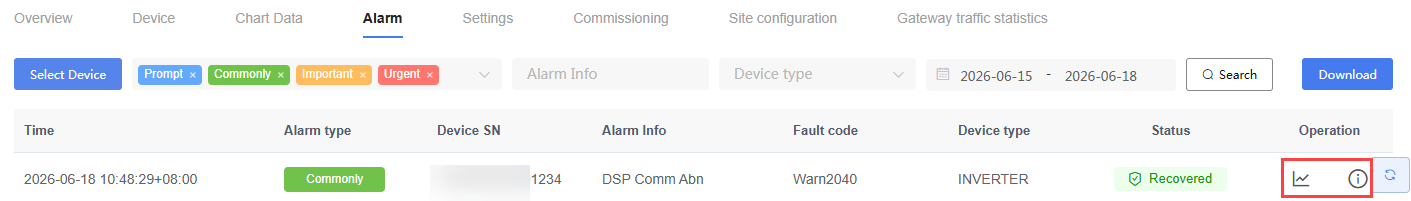
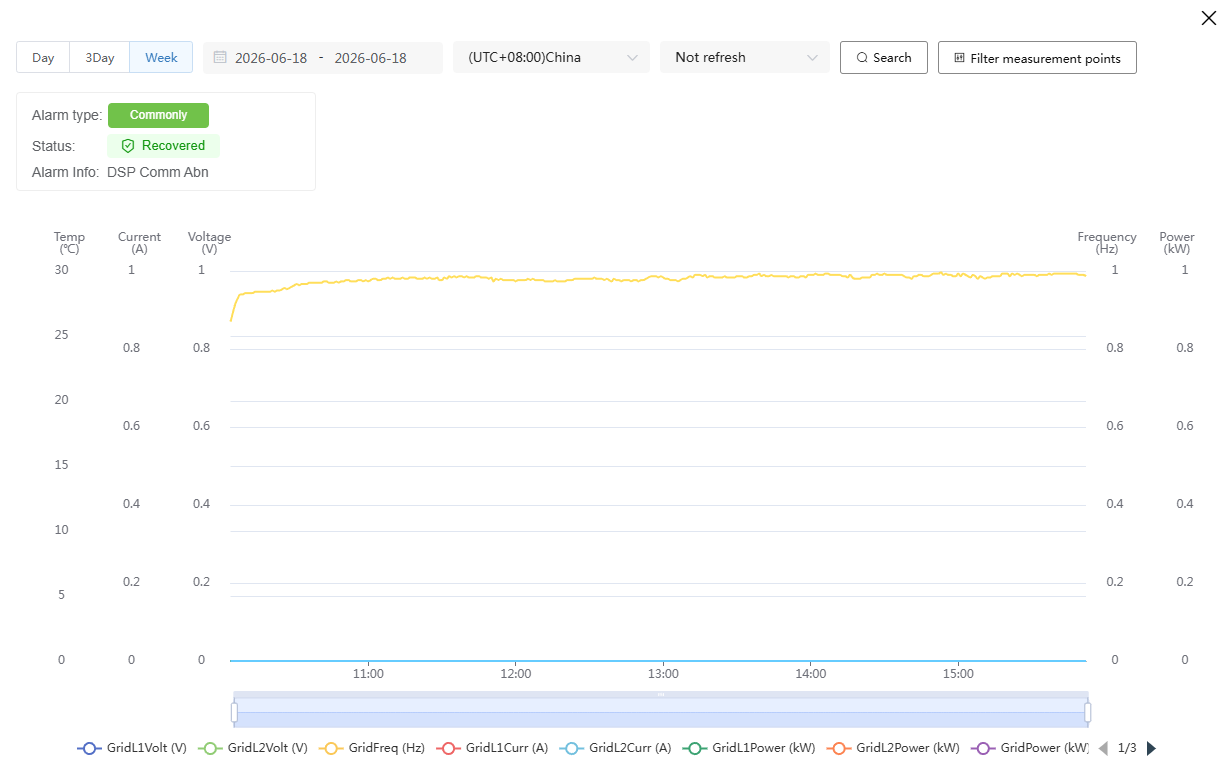
- Fault Curve: View the fault curve related to the Alarm.
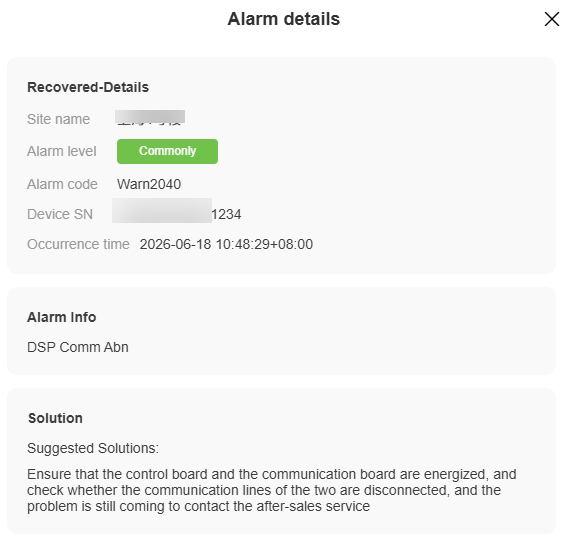
- Alarm Details: View detailed Alarm information.
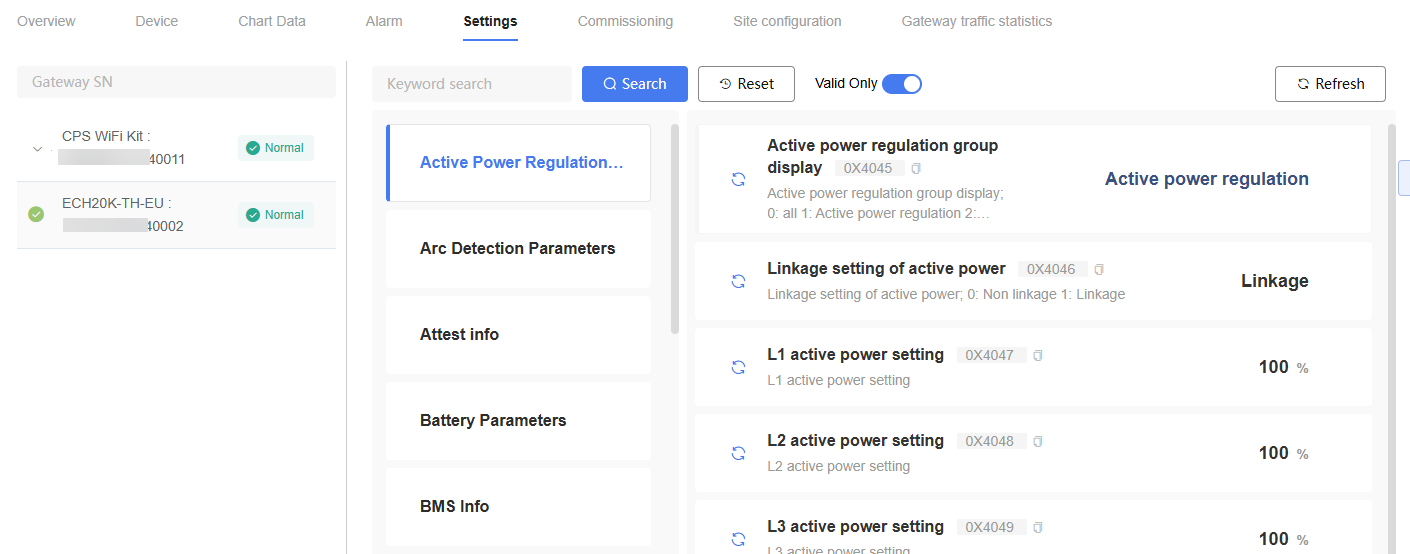
Settings
The "Settings" tab is used to remotely view and modify Device parameters.
TIP
The parameters and parameter groups supported may vary depending on the model.
Only parameters that support writing can be modified.
After modification, parameters are directly delivered to the Device. Please operate with caution.
It is recommended that only personnel with relevant permissions and expertise perform parameter configuration.
Steps:
Click the " Settings" tab.
Select a Device from the Device list.
In the parameter group list, select the parameter group you wish to view, then locate the parameter you wish to view or modify on the right side of the page. (To find a specific parameter, you can also enter a keyword in the search box and click "Search".)
To restore the default display conditions, click "Reset".
To view only valid parameters, enable the "Valid Only" toggle.
To refresh the page data, click "Refresh".
Commissioning
The "Commissioning" tab is used to generate, download, update, and manage commissioning reports.
Create Commissioning Report
Click the "Commissioning" tab.
Click "Create".
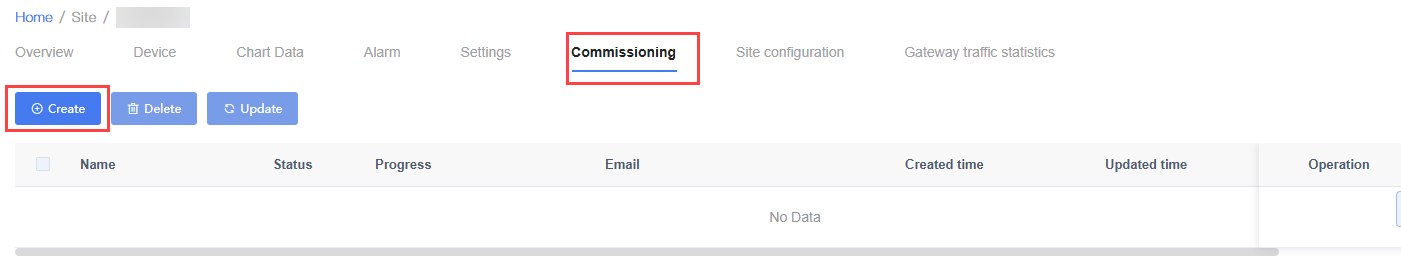
Enter the report name, fill in the email address (optional), select the Gateway, then click "Confirm".
The system creates a commissioning report generation task.
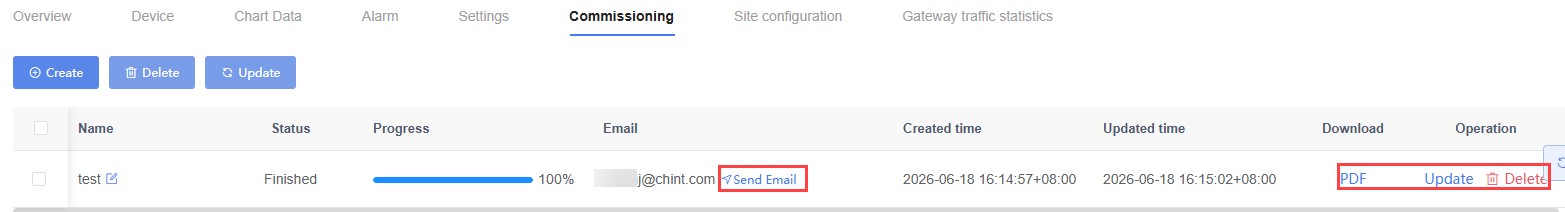
Report Operations
After the commissioning report is generated, you can perform the following operations:
Send Email: Send the report to the specified email address.
Download: Download the commissioning report in PDF format.
Update: Regenerate the report.
Delete: Delete the report.
Batch update and batch delete of reports are supported.
Site Configuration
The "Site Configuration" tab is used to maintain basic Site information, including the Site image, region information, Site type, grid connection method, and Revenue calculation-related parameters.
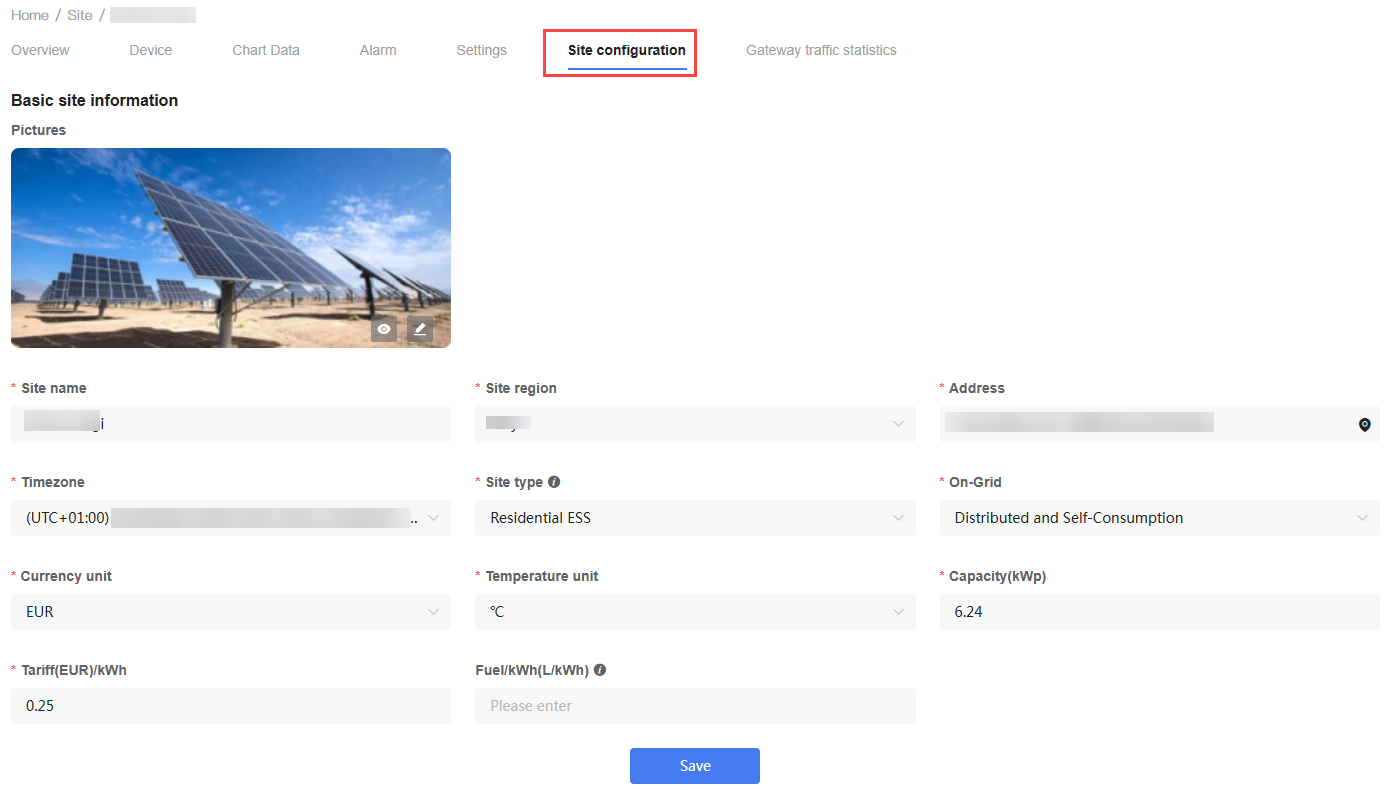
Steps:
In the Site list, click the target Site name to enter the Site Details page.
Switch to the "Site Configuration" tab.
Modify the relevant configuration parameters as needed.
Click "Save" to apply the changes.
Setting Descriptions:
| Setting | Description |
|---|---|
| Site Image | Upload or replace the Site photo for Site display. Supports common image formats such as JPG, JPEG, and PNG. |
| Site Region | Select the country or region where the Site is located. |
| Site Address | Enter the actual installation address of the Site. |
| Site Type | Select the Site type, such as Residential PV, Residential PV + Storage, or Commercial & Industrial Storage. |
| On-Grid | Select the corresponding grid connection method for the Site. |
| Currency unit | Select the billing category to which the Site belongs. |
| Temperature Unit | Set the temperature display unit (℃ or ℉). |
| Capacity | Enter the total installed capacity of the Site. |
| Tariff per kWh | Enter the local electricity price for Revenue calculation. |
| Fuel per kWh | Applicable to diesel generator-related scenarios, used for energy saving and emission reduction statistical calculations. |
TIP
Modified configurations immediately affect Site display information and some statistical data calculation results.
It is recommended to regularly maintain the Site image and basic information to ensure Site information accuracy.
After modifying parameters such as electricity price and installed capacity, relevant Revenue statistical results may change.
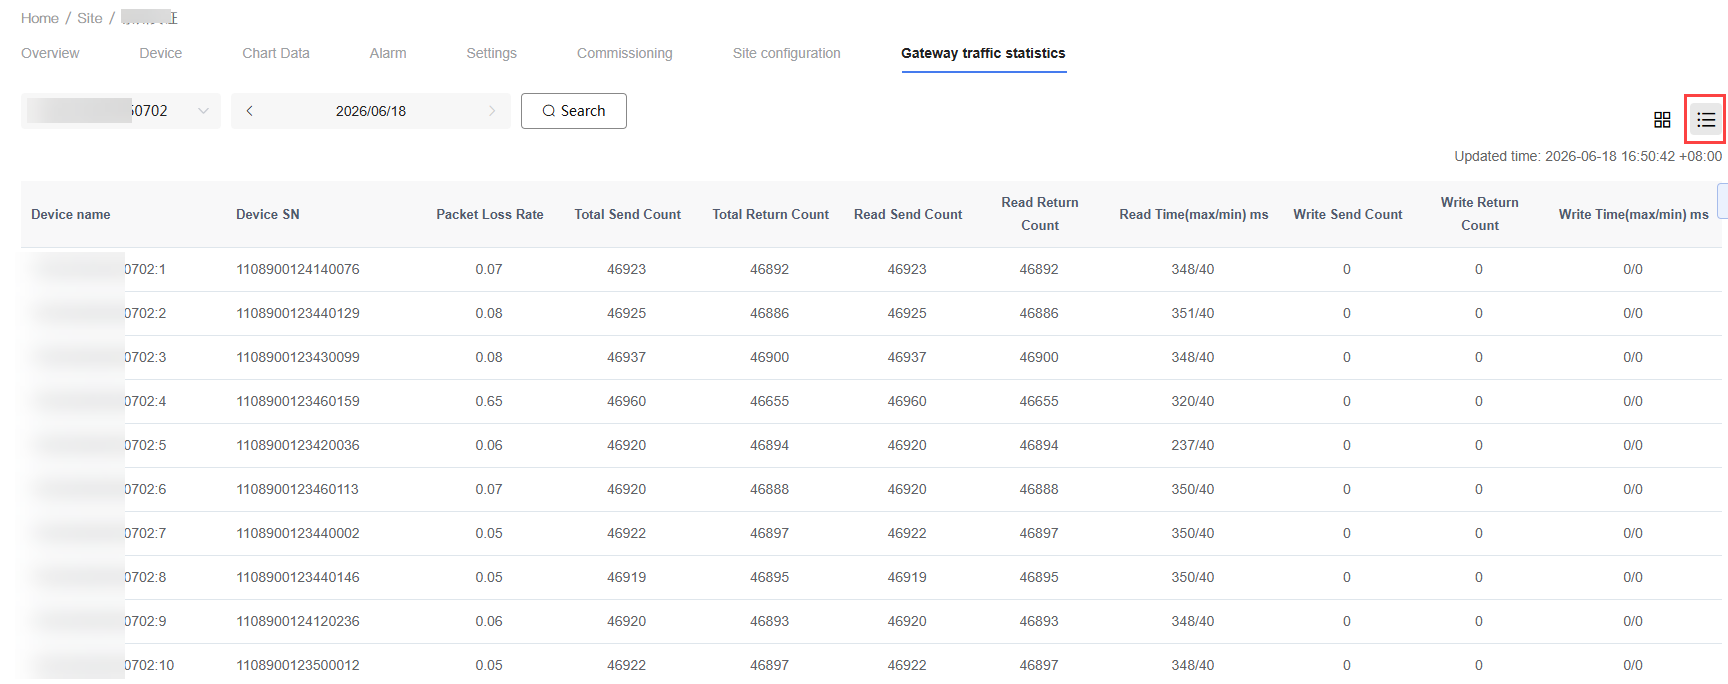
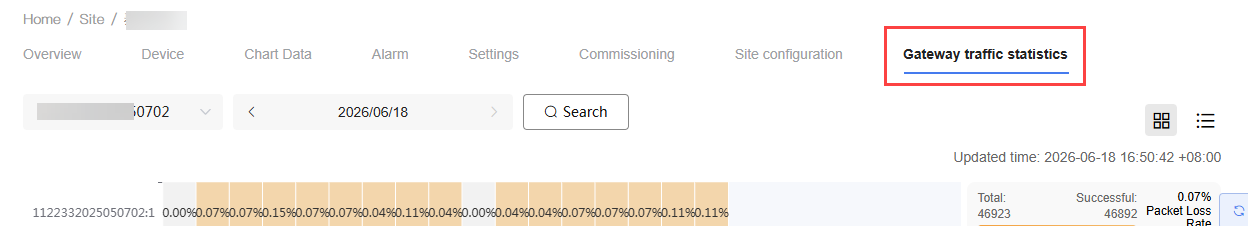
Gateway Traffic Statistics
The "Gateway Traffic Statistics" tab is used to view the communication quality and data transmission/reception between Gateways and Devices, helping maintenance personnel analyze communication stability, identify abnormal Devices, and locate potential network issues.
View Gateway Statistics
In the Site list, click the target Site name to enter the Site Details page.
Switch to the "Gateway Traffic Statistics" tab.
At the top of the page, select the Gateway you wish to view.
Select the statistics date.
Click "Search" to view the communication statistics results for the corresponding date.
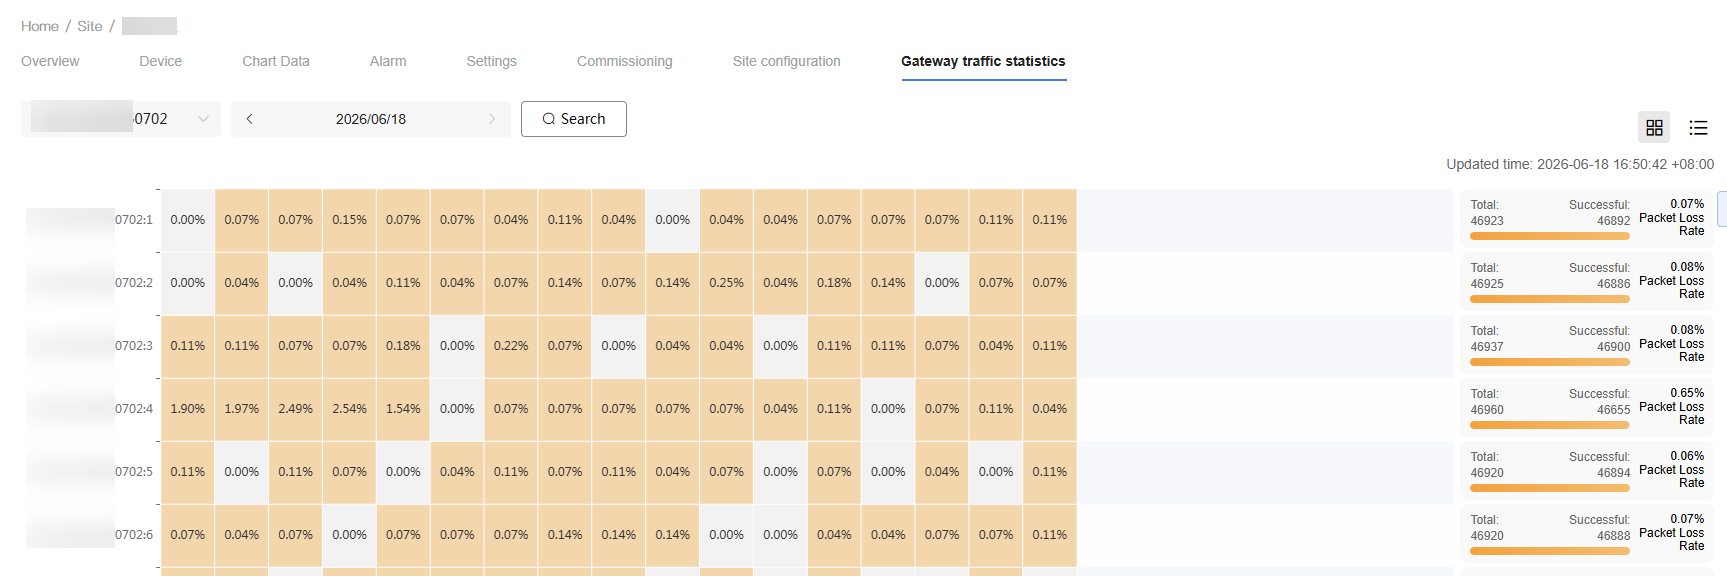
Heatmap View
The heatmap view uses color intensity to display the communication quality of each Device across different time periods.
The right side of the page displays Device communication statistics information, including:
Total transmission/reception count
Successful transmission/reception count
Packet loss rate
Maintenance personnel can use the heatmap to quickly identify Devices with poor communication quality or abnormal time periods.
List View
Click the list view icon in the upper-right corner of the page to switch to list mode to view detailed statistics.